Disclaimer: This blog and its author are not affiliated with ThinkProgress in any way. Designs featuring their likeness are for educational use only.
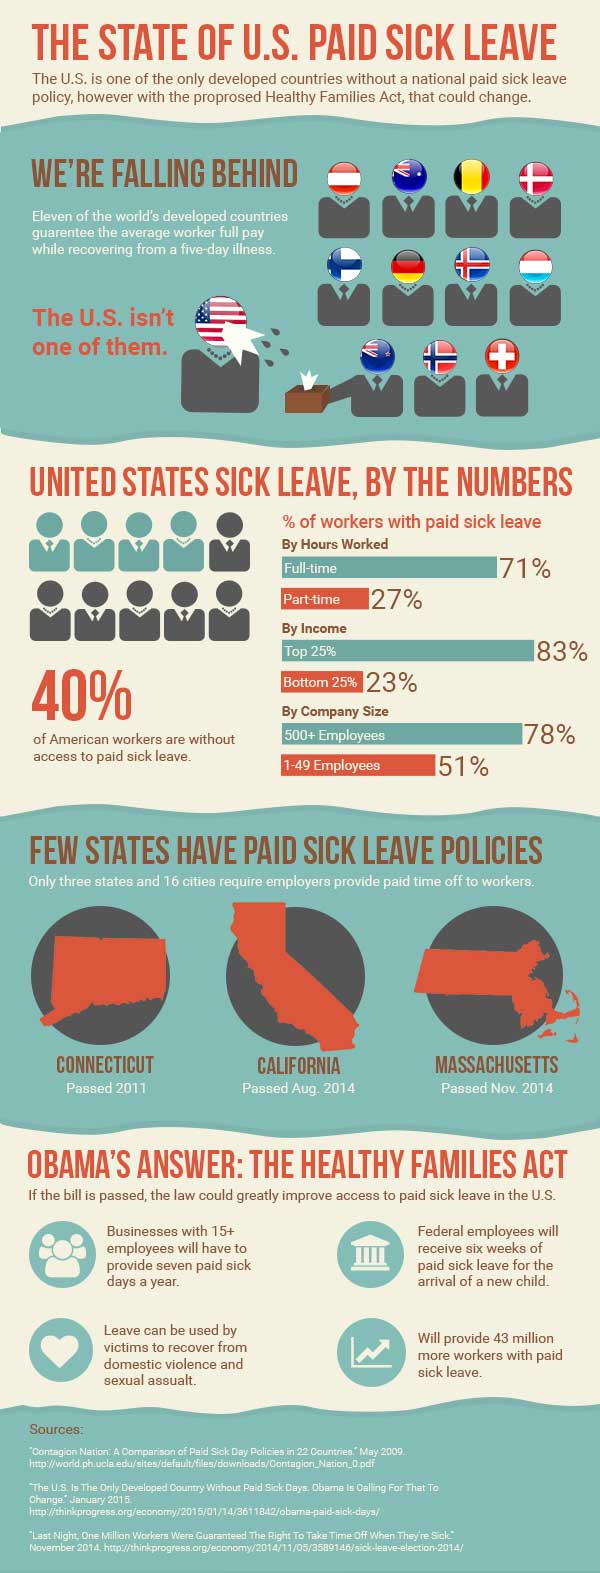
I think this week’s assignment was the most challenging yet. This week, I created an infographic based on an article by ThinkProgress, “The U.S. Is The Only Developed Country Without Paid Sick Days. Obama Is Calling For That To Change.” The article discusses the proposed Healthy Families Act as well as the current state of paid sick leave access in the U.S. In summary, the U.S. does not have a good reputation for paid sick leave, with many working Americans having no paid sick leave at all. The Healthy Families Act would try to improve on this issue.
Before I opened Photoshop, I first read through the article, as well as several other affiliated articles that were linked to in the original, including a brief research study on paid sick leave in the U.S. There were a lot of statistics referenced throughout these articles, and it was difficult to choose which points would work well for my infographic. I decided to focus on the current state of paid sick leave in the U.S. and after printing out the articles I wanted, highlighted the core facts I wanted to include. I wanted my infographic to give a well-rounded overview on paid sick leave in the U.S. so I focused on a few facts I thought would best fit this purpose.
I then sought out inspiration on Pinterest, looking for infographics and graphic elements I liked. Afterwards, I drew a very rough wireframe of my design so I could stay focused when designing in Photoshop. To determine the dimensions of my infographic, I actually found an infographic about that very topic. While there are no real set dimensions for infographics, I chose the common width of 600 px. I then started with a height of 1000 px but extended my canvas as needed.
The infographics I liked had a clear organization, with different sets of data or topics separated by boxes or borders. I decided to separate my design into six parts: the header, a section comparing the U.S. to other countries, a section on U.S. statistics, a section on existing state laws, a section describing the proposed new law, and finally a section for my sources. I used two different background fills to distinguish these different sections.
I wanted to display my data in a variety of ways in order to keep the infographic visually interesting, but also to illustrate each set of data in an appropriate way I used human figures and flags to display different countries. I used bar charts to illustrate comparative percentage stats. I also used simple images and icons to highlight short snippets of information about state laws and the new proposed Healthy Families Act. Each section is distinctively different in data display, however the consistent typography and color palette helps to provide consistency throughout. I also ordered my sections in a way I thought made sense and told the story of paid sick leave in the U.S., starting with the big international picture and moving into more and more details, first at the national level and then the state.
I used the pen tool to add character to my infographic through the use of custom shapes. In Illustrator, I created my simple worker figures used in my second section so I could use the Pathfinder panel to merge the shapes. Once I moved those figures into Photoshop, I added some fun extras with the pen tool, including the wet sneeze from Ms. United States, and the tissue box Mr. New Zealand so helpfully provides. I also used the pen tool to create my blue background boxes with the uneven borders. I believe these boxes, instead of basic rectangles, adds depth and another element of interest to the overall graphic.

